|
|
Hardware information tool
|
|
|
Hardware information tool
|
Designed as a visual control tool/temperature monitor/over the system after overclocking,the realization
gradually exceeded its original design and at the moment seems to have reached maturity enough.
I would divide the functionality into the following three general directions :
1) Main view
- OS basic/software/ information
- preview of the the available hardware
- momentary system status(current status) / sensors /
2) CPU utilization view - as a picture of the general idea of the system load
3) Temperature monitor view - tracking of the user selected sensors/if any/
4) Temperature monitor view - selected temperatures : In temperature mode
double click the drawing area with the left mouse button for details.
|
|
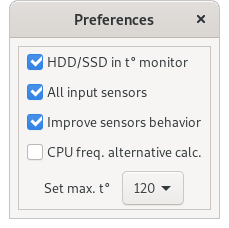
- HDD/SSD in t° monitor
Allows to also include the sensors of available HDD/SSD devices in temperature monitoring mode.
Off by default.
- All input sensors
By default the application considers all voltage sensors except Vcore(if recognized) as unimportant.
However,if you want to "monitor" the reports of all available sensors you can do so.
Off by default.
- Improve sensors behavior
Sensing sensor reading is not a trivial task.
Sometimes if you disable a sensor it may appear,disappear,appear again etc.
If there are sensors with similar behavior you can use this option,
so disable the sensor and enable this option.
Off by default.
- CPU freq. alternative calc.
By default,the application receives CPU frequency via cpuinfo.
But if you want you can get CPU frequency through scaling_cur_freq.
Off by default.
- Set max. t°
Sets the upper temperature limit in the temperature monitoring mode.
The default value is 120 °.
Q: I continually changing the dafault size of application window after launching,
can it be remembered?
А: After insallation application creates configuration file in which remembers user choice.
You need to install the application./See README file./
- CPU unit`s activity view
Q: Progress bar text value is 800 MHz,why CPU's unit frequence line indicates 0 in the graph?
А: The CPU's /unit/ minimal frequency is 800 MHz.The statement is correct.
You can see that(CPU min/max:) in the CPU section of the main view.
Feedback are welcome.Let me know if you have some problems or found a bug.